Using the Monitor Display Options
- 1st button—All Data
- 2nd button—Force Curve
- 3rd button— PaceBoat/PaceSkier
- 4th button—Bar Chart
- 5th button—Large Print
All Data
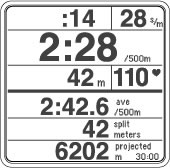 All Data provides the most comprehensive view of your workout. Depending on the type of workout you are doing (time, distance or interval), you can see the following information when looking at the All Data display:
- Time/distance elapsed/remaining
- Strokes per minute or revolutions per minute (PM5/BikeErg only)
- Workout intensity, displayed stroke-by-stroke and expressed as either pace per 500 meters or 100 meters for the BikeErg, Calories or watts (see Understanding Units for more information)
- Average workout intensity (in pace per 500 or 1000 meters, Calories or watts) or total time/meters
- Split time, meters, pace, Calories or watts (see Understanding Splits for more information)
- Projected finish, as follows:
- For time workouts, this shows the number of meters you’ll complete by the end of the workout
- For distance workouts, this shows how much time it will take you to complete the workout; for Just Row/Ski/Ride workouts, projected finish is 30 minutes
- For interval workouts, this shows your projected finish distance or time for the interval
Monitor Display Options and
Workout Data
1:58 Minutes
Force Curve
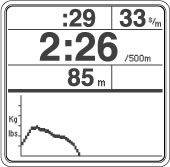 The Force Curve is an immediate graph of your power application during the stroke. When viewing the Force Curve display, the PM shows workout data on the top half of the screen and the force curve for each stroke on the bottom half.
For more information visit Working with the Force Curve and Using the Force Curve.
PaceBoat/PaceSkier/PaceRider
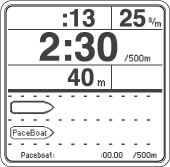 The PaceBoat/PaceSkier/PaceRider display allows you to row/ski/ride against a target pace, illustrated by either a pace boat or a pace skier. When viewing the PaceBoat/PaceSkier/PaceRider display, the PM shows workout data on the top half of the screen and the pace boat, pace skier or pace rider on the bottom half.
You can define a target pace when setting up a new workout, or you can use the ReRow/ReSki/ReRide function to set the target pace to a pace from a workout done in the past. If you don’t set a target pace, the pace boat/skier/rider matches your current workout pace.
For more information, visit Using the PaceBoat/PaceSkier.
Bar Chart
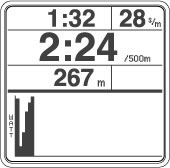 The Bar Chart display shows your power output in watts by painting a bar chart/graph for each stroke you take. (If you are using heart rate equipment, the Bar Chart displays heart rate intensity instead and paints a new bar every 10 seconds.) The higher the bar, the more power you have generated in that stroke, or the faster your heart is beating in that 10 second period.
When viewing the Bar Chart display, the PM shows workout data on the top half of the screen and the bar chart for each stroke on the bottom half.
Large Print
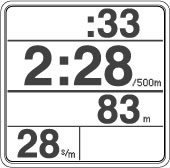 The Large Print display shows pertinent workout data in a large font for easier viewing.