

Email: [email protected]Phone: 800.245.5676
/blog/ergdata-feature-enhanced-force-curve
ErgData Feature: Enhanced Force Curve
Jul 15, 2026
Share

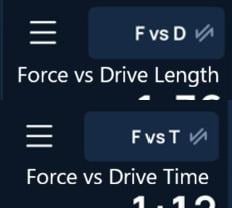
The force curve has been a valuable coaching tool on the Concept2 Performance Monitor (PM) for decades, helping rowers visualize how force is applied throughout the drive phase of the stroke. The latest ErgData update builds on this by taking advantage of the greater screen resolution of your phone or tablet, to give you the choice to plot force against drive time or drive length, and by adding a range of new metrics that provide deeper insight into technique.
Force Curve Basics
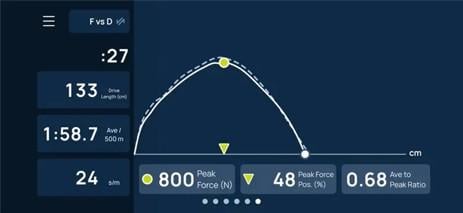
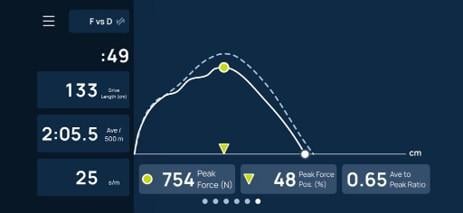
Different coaches each have their own “ideal” force curve. The shape reflects how they prioritize the sequencing and coordination of the legs, trunk, and arms. We’re not going to debate the ‘perfect’ curve, but it is true for all curves that smooth is better than bumpy. A bump illustrates disjointed application of force. It is also true that force curves should be consistent from one stroke to the next, even under fatigue. So, the solid line (your most recent stroke) should map closely to the dotted line (your previous stroke).
To illustrate smooth and consistent; these curves are ‘better’,
than these,
The force curve screen in ErgData includes new metrics. Tap one of the three boxes under the curve and you will be presented with the following options:
- Peak Force (newtons): The maximum force applied during the drive.
- Relative peak force position (%): Where peak force occurs during the drive.
- Drive Length (cm): The distance covered during the drive phase.
- Drive Time and Recovery Time (sec): How long you spend driving and recovering.
- Drive to Recovery Ratio (decimal).
- Work (joules): Average Force x Drive Length – the area under the curve.
- Average Force (newtons): The average force throughout the stroke.
- Average Force/Peak Force Ratio (decimal).
No single metric tells the whole story. The real value comes from observing how the numbers change and interact. Can work be maintained as rate increases? Does peak force position move for different intensities? Is the same true of the average to peak force ratio? How do these numbers compare to crewmates?
By combining visual feedback with objective data, rowers can gain a deeper understanding of their stroke.
Please Note
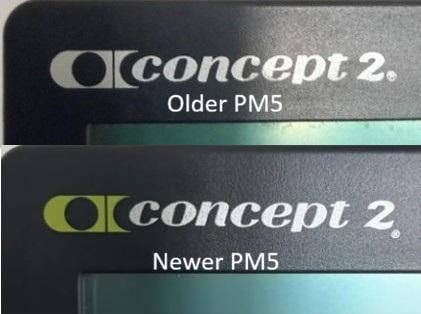
The full force curve experience requires the latest ErgData release, a PM5 that is less than 10 years old, and the latest PM5 firmware. If the PM5 is less than 10 years old, it will have a green Concept2 logo in the top left corner. Any PM5 with a green logo running the latest firmware will allow you to tap between force vs.drive time and force vs.drive Length. If the PM5 is more than 10 years old, it will have a white Concept2 logo. Unfortunately, these earliest PM5s cannot transmit force curve information to ErgData. So, the ErgData force curve is unavailable with the oldest PM5s.
Whether you're a beginner looking to improve technique, a coach working with athletes, or an experienced rower searching for marginal gains, the enhanced force curve screen with the choice of metrics, offers valuable feedback that can help connect what you feel on the machine with what is happening during each stroke. Transforming the graph from a simple visualization into a more powerful performance analysis tool. To view the ErgData force curve during a workout, simply swipe across the workout screens until the Force Curve display appears.
Recent Posts
Get Updates and Training Tips from Concept2
Tags: